|
Background: Water service providers invoice most South African urban consumers for the water they use every month. A secure treasury system generates water invoices at municipalities’ financial departments. Information about the water usage of customers initially comes from reading the water meters, usually located in gardens near the front boundaries of properties. Until as recently as 1990, the main purpose of the water meter readings was to generate invoices for water usage. There are various treasury systems for this purpose.Objective: The objective of this research article was to describe the development of Swift, a locally developed software tool for analysing water meter data from an information management perspective, which engineers in the water field generally use, and to assess critically the influence of Swift on published research and industry. This article focuses on water usage and the challenge of data interchange and extraction as issues that various industries face. Method: This article presents the first detailed report on Swift. It uses a detailed knowledge review and presents and summarises the findings chronologically. Results: The water meter data flow path used to be quite simple. The risk of breaches in confidentiality was limited. Technological advances over the years have led to additional knowledge coming from the same water meter readings with subsequent research outputs. However, there are also complicated data flow paths and increased risks. Users have used Swift to analyse more than two million consumers’ water meter readings to date. Studies have culminated in 10 peer-reviewed journal articles using the data. Seven of them were in the last five years. Conclusion: Swift-based data was the basis of various research studies in the past decade. Practical guidelines in the civil engineering fraternity for estimating water use in South Africa have incorporated knowledge from these studies. Developments after 1995 have increased the information processing capacity for water meter data.
Background to water information management
Water is a scarce resource, particularly in South Africa. Research in various fields is addressing the need to manage water use and water resources better as well as to ensure the equitable distribution of water to all South Africans. This responsibility usually rests with engineers who face increasing volumes of data from millions of water meter readings gathered over time.The drive to improve equity of supply and to conserve water in general has led to the neglect of information management. This study has adopted the term ‘water information management’ (WIM) from Jacobs (2008:4) because it relates to residential water usage and managing related data. The definition of WIM is ‘to manage the information pertaining to how and when water is used better.’ WIM is a prerequisite for gaining knowledge from water meter data and effective water demand management (WDM). The need for relevant, timely and sufficiently accurate information has increased to a point where it needs advanced software tools and specialised consultants.
Focus of the study
Engineers have used a software package called Swift extensively over the past decade to help them plan water systems (Fair & Compion 2008:49) and, as a spin-off, to assist research into water demand. The Water Research Commission (WRC) compiled the South African National Water Consumption Archive (NWCA), which contains Swift-based data, in 2007. It contains the monthly water usage records of more than two million South African consumers (Van Zyl & Geustyn 2007:3) and probably includes the data of each local reader of this paper. Swift also incorporates functionality for electricity meter data.What is Swift, where did it start, and how does it function? The only published answers to these questions come from Fair, Loubser, Jacobs & Van der Merwe 2008 (2008:5). These authors provide a very short review of Swift in the description of their research methodology. The current study is the first to report what one could call ‘The Swift story’. Its particular focus is the academic effect that Swift brought about as it pertains to water use.
Scope
The problem of data interchange and management information system (MIS) extraction is a common challenge in industries, as is the method of collecting the data in the first place. Reports of data analyses from various industries, which are relevant to residential services, include electricity usage (Taylor 1975; Andersson & Damsgaard 1999; Ziramba 2008), sewerage (Butler 1991), petrol and electricity (Houthakker, Verleger& Sheehan 1974), fuel wood (Garbacz 1985a) and fuel oil (Garbacz 1985b). The data these authors analysed, and the methods they used, include consumer perceptions (with spreadsheet-based analyses), study-specific recorded information (through specially installed meters and data loggers) and various methods of extracting data and their subsequent spreadsheet analyses. Some of these studies use elasticity analysis and evaluate how ‘susceptible’ one parameter is to change in another. However, the researchers decided it was beyond the scope of this study to cover elasticity analysis and other techniques. The attention of this article is only on residential water usage.
Relevance and motivation
Water meter readings are particularly relevant to a number of people. They include: • municipal treasurers, who see them as sources of income
• water consumers (like home owners), who receive monthly water invoices from treasurers
• the municipalities’ consultants (like financial and technical consultants), who use this information and knowledge for analyses and planning in their respective fields
• academics in the field, who require access to the raw data for further research. Unfortunately, problems often contaminate the data. They include duplicated records and errors at source. There also seems to be no standard for water meter data in treasury systems. These problems need to be resolved before using the data, or during its extraction. The aims and objectives of enterprise information architecture (EIA) in organisations (Iyamu 2011:5) are particularly relevant to this topic because it includes reducing integration complexity, controlling duplication and replication, validation and correction at source as well as standards for accessing information. The same information is particularly relevant to organisations like municipalities, consultants and academic institutions. Galbraith (1977:49) identified five main organisation design strategies in two categories: • increased information processing capacity
• reduced need for information processing. The subsequent development of a novel tool (Swift) has increased information processing capacity so that it extends beyond financial systems. Its development and working are the focus of this article. It allows for off-site processing because of restricted access and system performance. Some advanced software tools intended for financial management incorporate components to manage water meter data. However, their focus is on finances. The researchers spent considerable time reviewing the literature on products similar to Swift. However, they could not identify any peer-reviewed publications on the results from similar products. Swift is a technical tool that focuses on analysing water demand and provides sufficient information for researchers to analyse water usage based on meter readings with certain filters and technical criteria. A substantial review of other work and communication with researchers locally and abroad suggests that researchers usually use Microsoft Excel to achieve the same purpose by importing text-format extracts from treasury data base information (Du Plessis 2012; Fuamba 2012).
|
Information and data flow
|
|
Information managers often use data flow diagrams. They are convenient tools for illustrating how systems process data in terms of various inputs and outputs. One of the elementary components of a data flow diagram is a file or database. A number of municipal databases are relevant to the work presented here and include:• treasury system data
• town planners’ databases with their spatial attributes
• asset registers and infrastructure databases
• technical models of pipe networks to model the flow of water in pipes. The flow of data between these different databases is often complex and the sensitive nature of the data makes it complicated. Swift provides an interface between data sources and creates the potential to mine information.
|
Swift as a tool for managing water information
|
|
The need for a ‘Swift tool’
Water service providers need to optimise their services to consumers by providing sufficient and affordable water. Therefore, the need for accurate information about the system is becoming ever more important. Van Rooyen (2002:2) underlines the importance of using technology to improve the flow of information for management purposes. The information that technical staff members need is available in municipal treasury databases. They store the readings for every water meter in the system every month, along with land use and other property-related information. The same database contains confidential customer information, including customers’ arrears and general account information. Consequently, these databases are vigorously protected against unlawful access. The problem is that treasury systems were not designed to produce the information and statistical reports that the infrastructure managers and engineers need. This might make a case for integrated systems. However, in the absence of such systems (as is the case locally), there is a dire need from a technical perspective to obtain data from different treasury systems in some specified and predefined format. Van Rooyen (2002:3) noted the need for integrated systems as one of the factors that impede change in typical local treasury departments. With the current technology, treasury systems data rarely have spatial referencing. In other words, it is not always possible to pinpoint a particular customer on a map – which is exactly what an engineer or planner would like to do. Where it does exist, spatial referencing is never particularly accurate, largely because of mass linking of historical data at some point. Therefore, it is necessary to extract the available information from the databases and use additional manipulation through software designed for this purpose to improve spatial referencing. Financial systems were also not designed to perform the statistical calculations the various interested parties need. Although the calculations they need to produce the information are theoretically simple, the volume of data that is involved makes it difficult to use spreadsheets. Even in relatively small towns, where there are fewer than 15 000 properties, spreadsheets have become prohibitively inefficient and clumsy because of the large data sets of monthly water meter readings and additional data fields that interested parties need for analyses.
Purpose
The designers of Swift specifically intended it to make water meter data, formerly a closed source of data contained in municipal treasury systems, available to a wider audience such as municipal engineers and their engineering consultants. Later spin-offs would include access for academic use. The intended users were the infrastructure managers who could improve their work,
often stipulated in law, to ensure the effective management of water infrastructure.
Swift development and data extraction processes
GLS Software conceived the Swift idea in the early 1990s. The first application occurred when Centurion, a municipality near Pretoria, which is part of the Tshwane Metropolitan Municipality today, needed a water infrastructure master plan update. GLS Consulting Engineers, under the leadership of B.F. Loubser, conducted the project. At the time the Centurion technical team, comprising the Water Planning Engineer (F. Mouton), the Water Division Manager (L. Lötter) and the City Engineer (A. Lamprecht) were the key role-players. The municipality was using the PROMIS billing system of ICL. The Centurion engineering team became the main instigators of the concept when they insisted on developing an interface to the treasury system. It subsequently engaged GLS Software to develop a tool, which later became known as Swift. The main aim initially was simply to extract water consumption data for use in hydraulic models of the pipe network in order to plan infrastructure development. This would allow engineers to use accurate estimates of water flows in pipe models instead of estimates based on generalised guidelines for water use. At the time, the municipality appointed C. Triblehorn, a software programmer, to address the database application and programming. In conjunction with GLS Software, Triblehorn subsequently developed the first-ever interface between the new tool and the treasury system in about 1995. A considerable amount of the original structure and code base remains unchanged, although GLS Software is currently improving it to include better geographical information systems (GIS) integration. Centurion was not alone. Areas like the East Rand (now Ekurhuleni Metropolitan Municipality) also established similar databases and software models (Vorster et al. 1995:2). In order to access the treasury data at Centurion, ICL had to develop a routine for extracting the water consumption data from the PROMIS billing system whilst maintaining the integrity of the highly sensitive information. Centurion also needed information in addition to the water meter readings. It included meter reading dates, consumers’ names, property owners’ names, addresses or property codes (to place the users on a map and link the water usage to the closest pipe on the map), land use information, and water tariff codes and property valuations. Suburb allocations were also important because suburbs differed substantially socioeconomically and in water usage. A detailed technical review of the drivers of water usage, and the subsequent need for particular data fields from the treasury database, is beyond the scope of this article. However, the municipality usually extracts 30 data fields for each water consumer from the treasury database. Some of the fields extracted from treasury systems for use in Swift, like consumer and owner names, account numbers, property valuations and addresses are sensitive because of identity theft. Identity theft is an increasing local problem (Augustyn 2005:2). After debating the option of open database connectivity (ODBC) in the conceptual design of Swift, Loubser (2011) recalls that the municipality finally decided to use a snapshot extract as the best method of obtaining the data. The municipality decided that a one-way flow of information from the treasury system was the best option for maintaining the integrity of the treasury system and preventing unwanted access. Loubser (2011) gives a personal account and recalls going to the ICL office with the data specifications, meeting a programmer and walking out of the office a few hours later with a text file of about 30 000 lines. It contained just about all the data he required. For larger and more complex billing systems, the same process can take considerably longer to complete. Extracting the information continues to be an almost insurmountable struggle or very easy, depending on the type of treasury system and the level of co-operation. Land use and zoning information comes from the most accurate source of data for each municipality. These data sources include the town planning land use and zoning descriptions as well as the land use and zoning codes in the same database. Another source of information is the treasury system billing codes that should be accurate and up to date because municipalities use these codes to generate revenue. Therefore, it was necessary to develop flexible, generic algorithms in Swift to determine the most likely land use and zoning for each stand using a number of ranked data fields. It soon became clear that municipalities could use Swift to measure water losses by comparing the total water sales from all consumer meters (reported via Swift) to the total volume of water fed into the same region – recorded via a large water meter on the main water supply pipe. Having more than one supply pipe complicates the issue. However, it works in the same way in principle. Therefore, Swift provided a unique way of enabling engineers to measure the lost water in the system accurately and conveniently. The lost water is simply the difference between the water a municipality supplies to a town and all the water it sells – and records it in the treasury system.
Cross-referencing consumers to model nodes
One of Swift’s innovations is ‘cross-referencing’. In Swift terminology, this process is ‘X-Ref’. Figure 1 illustrates it.From an information management perspective, it is of little use to know how much water a consumer uses without knowing the consumer’s spatial whereabouts. In other words, municipalities need to know where the consumer is on a map relative to the water pipes in order to allocate the appropriate volume of water (from Swift) to the correct node in a hydraulic model of the water pipe network. The large yellow arrows show how six properties in the figure ‘connect to’ the water pipes and nodes: the red lines and yellow circles respectively.
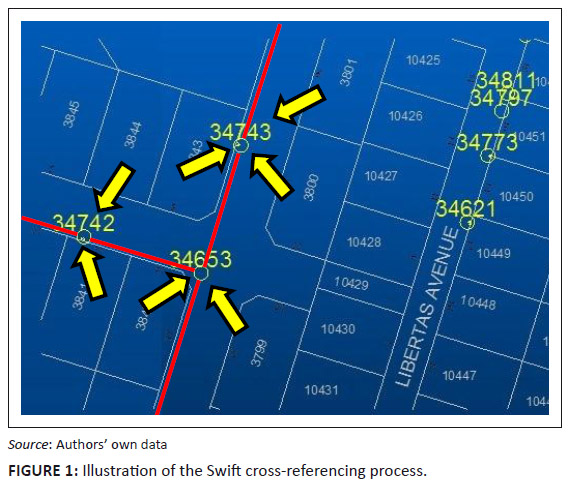 |
FIGURE 1: Illustration of the Swift cross-referencing process.
|
|
Treasury link
Municipalities obtain Swift databases from their treasury databases. Therefore, Swift has data for every stand and every meter in an area. Fields in the databases contain information about stand-related data like the owner, the consumer, the address, land use, zoning, consumption and tax tariffs of the stand. They also include the value of the stand and any improvements. Information about meters includes the meter readings, the meter serial number and the date of installation.The researchers adapted the illustration of Swift architecture and related databases, shown in Figure 2, from GLS Software. It shows the interface between treasury, GIS databases, Swift and the planning process. The components include, for example, aspects relevant to the hydraulic network models of the water and sewerage systems. The link is obvious and excluding it from the figure would be an oversight because the water usage Swift derives is a critical input for analysing the water flow in pipes for water (Wadiso software) and sewerage (Sewsan software). The researchers felt that further discussion of the hydraulic models, plan books, peak flows and master plans were beyond the scope of this article. Treasurers’ data are not open source and one needs a one-way ‘dump’ of information to obtain the data. After extracting the data from treasury systems and importing them to Swift, the information is available to users in a seamless structured table that they sort, query and save in reports if they need to. It is also possible to view the data and a graphical display of water consumption separately for each user. Various studies have found that it is important to validate the historical meter records users extract from treasury systems. Users need routines to identify and correct irregularities in the water meter readings. They include sudden drops in readings when municipalities replace a meter, spikes and/or dips in water consumption records and unrealistically high or low readings. Possible causes of these errors include faulty water meters and data capturing errors. There are also basic methods for checking the integrity of the latest readings against historical meter records. Swift allows users to customise some settings so that users can conduct analyses on any treasury database. For example, a large consumer in one town might not necessarily be a large user in another, larger town. Swift allows users to define the consumption that identifies the large users. Similarly, users can categorise suburbs and land use information into user specific groups so that users can obtain meaningful results from any system. Currently Swift extract routines integrate with at least 15 different treasury systems, including SAP, Venus and SAMRAS. Swift is in regular use in over 20 municipalities in South Africa and a few locations overseas.
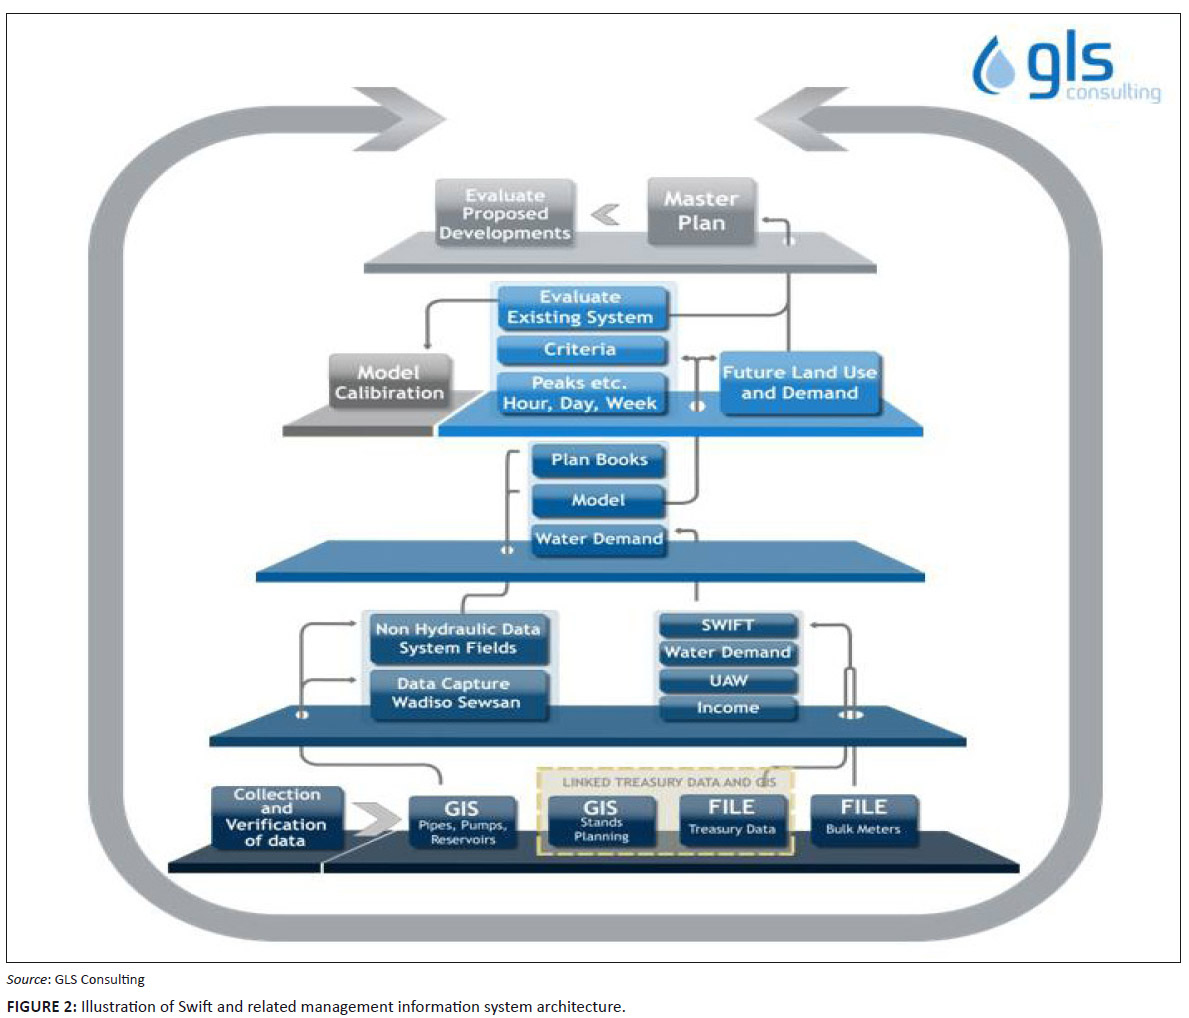 |
FIGURE 2: Illustration of Swift and related management information system architecture.
|
|
From water meter readings to knowledge
The information users obtain from Swift databases is ideal for research into issues relevant to water usage. This is particularly true for civil engineers who need information about water usage to analyse and plan water infrastructure systems, like pipe networks. Therefore, it is not surprising that the WRC funded an extensive research project to compile the NWCA to act as a source for further research (Van Zyl & Geustyn 2007:48). However, when one considers the chronological publication history of Swift-derived research, it is clear that the first decade of Swift’s application drew little academic interest. A review of publications that uses Swift data is the first and only of its kind in academic literature. The chronological list in Table 1 is particularly relevant to the South African Journal of Information Management (SAJIM) because each reference reflects a moment in time when users converted basic water meter readings, via a complex system (including Swift), to acquired knowledge that they disseminated in an academic publication. ‘Research’ implies discovering or verifying information (Oxford English Dictionary 2006).
Chronological review of Swift-based research
In the effort to obtain a better understanding of the origins of Swift data as sources for research outputs, it is necessary to review the related publications and researchers. GLS Software and its sister company GLS Consulting have always maintained strong links with various South African academic institutions, through collaborative research, student mentoring and external reviews. Therefore, it was obvious that research and publications would eventually follow. All the initial publications had connections with the University of Johannesburg (UJ) in some way. The first notable Swift-based publication in a peer-reviewed journal (Jacobs et al. 2004:2) appeared almost a decade after the first application of Swift. The main author was a doctoral student at UJ at the time. In an effort to improve the methods for estimating water demand in South Africa, Jacobs et al.
(2004) analysed the data, from Swift, of more than 600 000 water meters. Shortly afterwards, another Swift-based publication followed (Van Zyl & Husselman 2006:12). A University of Johannesburg master’s student and her promoter were the authors. The authors of these publications were involved in all subsequent academic writings on Swift-derived knowledge, although the research had expanded to include three South African universities by 2011. These are the University of Johannesburg (Griffioen, née Husselman), Stellenbosch University (Jacobs) and the University of Cape Town (Van Zyl). Table 1 gives a comprehensive chronological list of Swift-based publications. It emphasises the increasing application and relevance of Swift as an academic tool and as a way of managing water meter data.
The National Water Consumption Archive
One can regard the compilation of the National Water Consupmtion Archive (NWCA) in 2007 as the highlight to date in terms of academic outputs that use Swift. Compiling the NWCA was a combined effort between municipalities, whose information it was using, and GLS Software. It developed Swift and needed the water consumption records to improve service delivery. Various academics also needed the information to gain much-needed knowledge about water consumption in South Africa. The South African WRC funded the research project.However, problems of confidentiality soon hampered the academic application of the NWCA. In addition, legal problems about the availability of data in the NWCA led to a lack of published work in 2010 and 2011 (see Table 1) compared to the number of publications up to 2009. The right to data in the NWCA currently rests with the WRC, which provides selected fields to interested researchers upon request for the information and requires them to sign a confidentiality clause. The latter is necessary to protect individual water consumers, whose personal information resides in the NWCA. Therefore, potential researchers need to know exactly which data fields they require before the NWCA will release the data. Then, when researchers receive the data, they have to protect it against hackers, who could target the sources that become available afterwards on secure university networks.
|
TABLE 1: Chronological summary of Swift-based research outputs.
|
Future research needs
Swift has sparked local research into water usage. However, there are research needs that remain. One of the current issues is to maintain the NWCA or to update it regularly (maybe every two years). The NWCA is cumbersome and it needs to reorganise the data fields to make it more user-friendly and to allow researchers to access different classes of data. For example, one could describe each of the fields in the NWCA as general data (open access), personal (available on request) and classified (available after completing the legal forms).Researchers have presented several approaches to extending the functionality of the NWCA to a web-based tool (Sinske & Jacobs 2008:1; Van den Berg, Fair & Sinske 2008:209). However, this would require even more complex and rigid ways of preventing identify theft and of addressing confidentiality issues. As long as a decade ago, Van Rooyen (2002:4) reported that the Internet was linking many systems and participants in the market place. This created new benefits, but also new problems or risks. For example, hackers could attempt to access a network in order to steal intellectual property, databases and privileged information and sell the information to crime syndicates (Augustyn 2005:6). These threats impose limitations on the availability of data and restrict research. Finally, it is necessary to identify and describe ways of improving information management as well as the scope and limitations of using Swift-based data for research. Researchers are currently investigating and developing novel and more advanced software products based on the success of Swift. The current need in industry is to add even more value to the knowledge users gain from Swift to support decisions (like priority lists and query tools for managers) and spatial attributes (like maps). Tools like Google Earth, Google Maps and non-web based geographical information systems hold the key to the next level of increasing information processing capacity.
The authors acknowledge Dr B.F. Loubser (GLS Software) for his contribution to this study and for providing the overview of Swift development.
Competing interests
Both authors declare hereby that all efforts were made to be objective in executing and publishing this research. The authors declare that K.A.F. (GLS Software) has a financial relationship(s) which may be perceived by others to have
influenced the writing of this paper. The affiliation is noted on the title page.
Authors’ contributions
H.E.J. (University of Stellenbosch) was the main author and instigator of this research into the application and effect of Swift on research outputs. K.A.F. (G.L.S. Software) was a director of GLS Software at the time of the project and was responsible for the development of software produced by GLS, including Swift. H.E.J. (University of Stellenbosch) and K.A.F. (GLS Software) contributed equally to the research and this subsequent article. Nonconfidential data and information derived from Swift was kindly made available by GLS at no cost
for various research projects at three different South African universities in the past years.
Andersson, B. & Damsgaard, N., 1999, ‘Residential Electricity Use – Demand Estimations Using Swedish Micro
Data’, Proceedings of the 22nd IAEE Annual International Conference, Vol 2, International Association for Energy
Economics Rome, Italy, June 09–12, 1999, pp. 255–264.Augustyn D., 2005, ‘Identity theft escalation – You may need to change your life’, South African Journal of Information Management 7(4), 11 pages, December. Butler, D., 1991, ‘A small-scale study of wastewater discharges from domestic appliances’, Water and Environmental Management Journal 5, 178–185.
http://dx.doi.org/10.1111/j.1747-6593.1991.tb00605.x Du Plessis, J.A., 2012, email, 10 May, http://jadup@sun.ac.za Fair K.A. & Compion J.K., 2008, ‘The water distribution system master planning process in South Africa with a focus on metered demand, water loss monitoring, calibration and financial analysis’, in J.E. van Zyl, A.A. Ilemobade & H.E. Jacobs (eds.), Proceedings of the 10th Annual Water Distribution Systems Analysis Conference WDSA2008, Kruger National Park, South Africa, August 17–20, 2008. Fair K.A., Loubser B.F., Jacobs H.E. & Van der Merwe J., 2008, ‘The Dynamic Master Planning Process – Integrated and continuous updating and planning of sewer systems’, Proceedings of the 11th International Conference on Urban Drainage, Edinburgh, Scotland, UK, 31 August – 05 September, 2008. Fuamba, M., 2012, email, 16 April 2012, musandji.fuamba@polymtl.ca Galbraith J.R., 1977, ‘Organization Design’, Addison-Wesley, Reading. Garbacz, C., 1985a, ‘Residential Demand for Fuelwood’, Energy Economics 7(3), 191–193.
http://dx.doi.org/10.1016/0140-9883(85)90008-8 Garbacz, C., 1985b, ‘Residential Fuel Oil Demand: A Micro-Based National Model’, Applied Economics 17(4), 669–674.
http://dx.doi.org/10.1080/758534697 Houthakker, H.S., Verleger, P.K. & Sheehan, D.P., 1974, ‘Dynamic Demand Analyses for Gasoline and Residential Electricity’,
American Journal of Agricultural Economics 56(2), 412–418.
http://dx.doi.org/10.2307/1238776 Ilemobade A.A., Van Zyl J.E. & Van Zyl H.J., 2009, ‘New guidelines for non-domestic water estimation in South Africa’, Proceedings of Computers and Control in the Water Industry CCWI2009, September 01–03, 2009, The Edge, University of Sheffield, Sheffield, UK, 7 pages. Iyamu T., 2011, ‘The architecture of information in organisations’,
South African Journal of Information Management 13(1), Art. #419, 9 pages. http://dx.doi.org/10.4102/sajim.v13i1.419 Jacobs H.E., 2008, ‘Residential water information management’, South African Journal of Information Management 10(3), 12 pages. Jacobs H.E., 2007, ‘The first reported correlation between end-use estimates of residential water demand and measured use in South Africa’, Water SA 33(4), 549–558. Jacobs H.E., Geustyn L.C. & Loubser B.F., 2006, ‘Water – How is it used at home?’, Proceedings of the Water Institute of South Africa Biennial Conference, Durban, South Africa, May22–25, 2006, viewed n.d., from
http://www.ewisa.co.za/literature/ Jacobs H.E., Geustyn L.C., Loubser B.F. & Van Der Merwe B., 2004, ‘Estimating residential water demand in Southern Africa’, Journal of the South African Institution of Civil Engineering 46(4), 2–13. Loubser B.F., 2011, email, 05 August, http://erik@gls.co.za Oxford English Dictionary, 2006, ‘Concise Oxford English Dictionary’, 11th edn., revised and edited by C. Soanes & A. Stevenson, Oxford University Press, Oxford. Sinske A.N. & Jacobs H.E., 2008, ‘Modelling residential water use with a web-based tool’, in P.A. van Brakel (ed.), Proceedings of 10th Annual Conference on World Wide Web Applications, September 03–05, 2008, Cape Town, South Africa, Cape Peninsula University of Technology, viewed n.d., from
http://www.zaw3.co.za Taylor, L.D., 1975, ‘The demand for electricity: A Survey’, The Bell Journal of Economics 6 (Spring), 74–110.
http://dx.doi.org/10.2307/3003216 Van den Berg T.N., Fair K.A. & Sinske A.N., 2008, ‘What are the benefits of universal water metering? Lessons learned at the district of West-Vancouver, British Columbia, Canada’, in J.E. van Zyl, A.A. Ilemobade & H.E. Jacobs (eds.), Proceedings of the 10th Annual Water Distribution Systems Analysis Conference WDSA2008, Kruger National Park, South Africa, August 17–20, 2008, pp. 209–220. Van Rooyen J.H., 2002, ‘Emerging role of corporate treasury management in cyber space’, South African Journal of Information Management 4(4), 14 pages, December 2004. Van Zyl H.J., Ilemobade A.A. & Van Zyl J.E., 2008, ‘An improved area-based guideline for domestic water demand estimation in South Africa’, WaterSA 34(3), 381–392. Van Zyl J.E. & Geustyn L.C., 2007, ‘Development of a National Water Consumption Archive’, WRC Report No. 1605/1/07, South African Water Research Commission, Pretoria, South Africa. Van Zyl J.E. & Husselman M.L., 2006, ‘Effect of stand size and income on residential water demand’, Journal of the South African Institution of Civil Engineering 48(3), 12–16. Vorster J., Geustyn L.C., Loubser B.F., Tanner A. & Wall K., 1995, ‘A strategy and master plan for water supply, storage and distribution in the East Rand region’, Journal of the South African Institution of Civil Engineering 37(2), 1–5. Ziramba, E., 2008, ‘The demand for residential electricity in South Africa’, Energy Policy 36(9), 3460–3466.
http://dx.doi.org/10.1016/j.enpol.2008.05.026
|